Q2 2023 Colony Market Perspectives
Q2 2023 Colony Market Perspectives
With the S&P 500’s 8.7% return during the second quarter, U.S. equities have unofficially entered a new bull market, up more than 24% from their October 2022 lows. Neither the regional banking crisis nor the debt ceiling dispute were enough to derail the positive momentum that has taken hold of the investment markets this year.
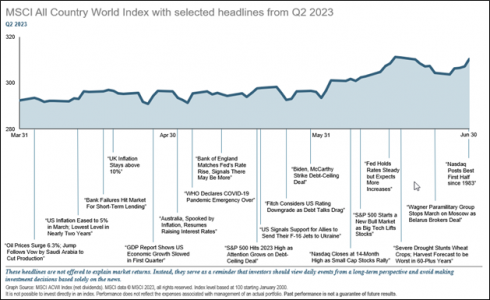
International equity markets posted positive returns for the quarter, with the MSCI ACWI ex-USA Index up 2.4%, but were unable to keep up with U.S. equities despite generally stronger performance since last fall. China’s economic reopening from COVID lockdowns has thus far underwhelmed. As the world’s second largest economy, China remains an important end market for many countries’ exports, and slower than expected growth there has some analysts reducing estimates for global earnings.
Bonds, on the other hand, experienced small losses during the quarter. Core inflation remains stubbornly high, forcing central banks to remain hawkish. Indeed, most major central banks raised interest rates during the quarter, weighing on the returns of most bond markets. The Bloomberg U.S. Aggregate Bond Index returned -0.8% in the second quarter, its first decline following two consecutive positive quarters.
Investors remain laser-focused on Federal Reserve (Fed) policy. The decision to pause raising interest rates at the June meeting was overshadowed by the forecast for further increases later this year. Interest rates are only one component of monetary policy, however. Quantitative tightening, whereby the Fed removes dollars from the system by either selling bonds held on its balance sheet or simply allowing them to mature without reinvestment, started in earnest last year. Its impact on liquidity is just starting to work its way through the economy and financial markets. In the remainder of this newsletter, we take a closer look at how policy is reducing liquidity and perhaps contributing to the equity markets’ narrow leadership.
Liquidity Trap
Since the Fed commenced extraordinary monetary stimulus measures during the pandemic, liquidity within the financial system has been on a roller coaster ride. In 2020, with the economy under pandemic lockdowns, the Fed began quantitative easing, flooding the system with liquidity to prevent a financial meltdown. Unintentionally, more stimulus was delivered during the first half of 2023, emanating from policies associated with the regional banking crisis and debt ceiling suspension. Now, these trends are reversing due to the Fed’s quantitative tightening and the replenishment of the Treasury’s General Account.
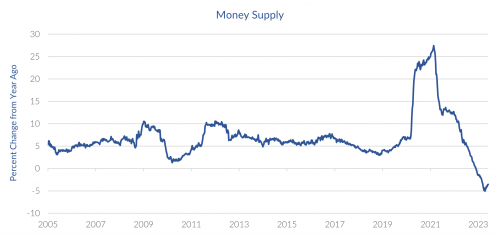
One way to analyze liquidity is by measuring the supply of money using a metric called M2. M2 is calculated as the aggregate dollar value of cash, checking and savings account balances, and other short-term savings vehicles. The graph below shows clearly how unusual the past several years have been, even in comparison to the huge amounts of monetary stimulus put in place during the Great Financial Crisis. M2 increased more than 26% year-over-year at its peak in 2021 and, as of recently, is down nearly 4% year-over-year.
The link between money supply and the economy is disputed by economists. In theory, an increase in the money supply reduces the cost of money through lower interest rates, making it more attractive to borrow. This provides fuel for individuals and businesses to increase consumption. When the supply of money decreases, as it is now, it presumably would cause interest rates to rise, curtailing the demand for borrowing and slowing growth. Sometimes, however, the liquidity injected into the system by the Fed bypasses the real economy and flows directly into financial assets. In those cases, a decrease in the money supply may provide a headwind to investment returns.
WHAT THIS MEANS
We believe the enormous amounts of monetary stimulus put in place during the pandemic supported both economic growth and investment markets. As this liquidity is removed, it may curb both. After all, the Fed’s explicit intent is to slow the economy so that inflation decelerates.
There are several reasons to believe that the impact from a shrinking money supply may be limited. Importantly, the Fed does not intend to unwind all the excess liquidity they put into place. Indeed, the Fed intends to shrink its balance sheet but not back to pre-pandemic levels. Moreover, money supply is not the only variable that affects liquidity. Changes in liquidity arise from a mismatch between the supply and demand for money. M2 looks at only the supply side of the equation. Demand for the safety of cash is typically a function of investor sentiment. When markets are calm, the demand for cash is reduced thus easing the liquidity constraints.
Bad Breadth
In past letters, we have encouraged investors to look beyond an index’s headline performance to better understand what is happening in the equity markets. A deeper look beneath the surface often reveals important information about the mood of investors.
So far this year, a small group of the stock market’s largest stocks is leading the markets higher. A good way to measure this is to compare the return of the S&P 500, a size-weighted index, to the return of an equal-weighted version of the same index. Year-to-date through June 30th, the market-cap-weighted index has returned 16.9% compared with only 7.0% for the equal-weighted version. If this difference is maintained over the remainder of the year, it will mark their fourth-widest return discrepancy since 1990.
Just seven stocks contributed 12.3% of the 16.9% return of the S&P 500 during the first half of the year: NVIDIA, Meta, Amazon.com, Apple, Microsoft, Tesla, and Alphabet. In addition, the five largest stocks in the S&P 500 Index, which include all the aforementioned companies except for Meta and Tesla, comprise over 24% of the index’s total capitalization, a new record high, surpassing the previous records set during the dot.com bubble and the pandemic.
Certainly, these stocks have strong fundamentals, including exceptional profitability and growth. Nevertheless, some of their gains can be attributed to investor exuberance. The widespread publicity surrounding generative artificial intelligence, specifically ChatGPT, has stoked investors’ imagination. Many stocks associated with artificial intelligence have soared. The most striking example is NVIDIA, which is up 189.5% this year, adding more than $680 billion of market value, and becoming only the sixth company in the world to reach a $1 trillion market cap.
WHAT THIS MEANS
Narrow markets do not necessarily portend doom and gloom. In fact, a closer look at the past decade plus reveals consistently narrowing market leadership, concentrated within the technology, communication services, and consumer discretionary sectors. Despite this, the period was one of the longest market expansions in history.
We do not expect the index to remain this concentrated over the longer term. In the past, markets exhibiting narrow leadership have either corrected or broadened out. There are some reasons to believe that the latter is more likely. Consider that most of this year’s biggest winners were last year’s biggest losers. Their recovery may reflect oversold conditions coming into the year. In addition, we may be seeing early signs of emerging new leadership. For example, in June, small-cap stocks found support and outperformed their large-cap peers. While it is too early to call it a trend, it is a step in the right direction.
Index concentration reflects changes to the broader U.S. economy. The rapid transition to a knowledge-based economy has contributed to this phenomenon. With the launch of ChatGPT last November, artificial intelligence has taken a huge leap forward towards unleashing the next long-wave productivity revolution which could result in new market leadership.
Conclusion
We expect to get answers to investors’ most pressing questions over the course of the second half of the year, such as what happens with inflation, will the U.S. economy go into a recession, and when will the Fed finish hiking interest rates. Currently, inflation is losing momentum but whether it reaches the Fed’s target of 2% is hard to predict. In addition, economic growth has remained solid despite many pundits calling for a recession in the first half of the year. Lastly, the Fed skipped raising rates at the June meeting but has indicated they are likely to raise them again at their next meeting.
Investor uncertainty provides the fuel that keeps risk assets well bid. Due to this uncertainty, investors likely still have cash on the sideline waiting for the right opportunity to invest. As markets continue higher, fear of missing out takes over and cash gets deployed into the markets. This becomes a virtuous circle until the last holdouts capitulate and all the dry powder that was pushing markets higher is exhausted. This phenomenon is often referred to as climbing a wall of worry, and likely explains why markets have continued to advance. Whether it persists will require answers to some key questions.
Sources: Strategas, BCA Research, Alpine Macro, and FactSet.


